By Jon Huang
The following statistics were obtained from the Community Crime Map website at https://www.communitycrimemap.com/, which obtains information directly from local police agencies, including the Colorado Springs Police Department and the El Paso County Sheriff’s Office. The data below was based on crime data from 2019-2024 and was measured from a 4-mile radius around Black Forest and Falcon areas as designated by Google Maps. The information below provides an estimate of the number of crimes with a breakdown by category. Definitions of listed offenses can be obtained from the FBI website at
https://ucr.fbi.gov/crime-in-the-u.s/2017/crime-in-the-u.s.-2017/topic-pages/offense-definitions.
Total number of yearly crime incidents 2019-2024
| Year (Sept to August) | Black Forest | Falcon |
| 2023-2024 | 292 | 450 |
| 2022-2023 | 295 | 580 |
| 2021-2022 | 421 | 568 |
| 2020-2021 | 659 | 717 |
| 2019-2020 | 388 | 628 |
Trends
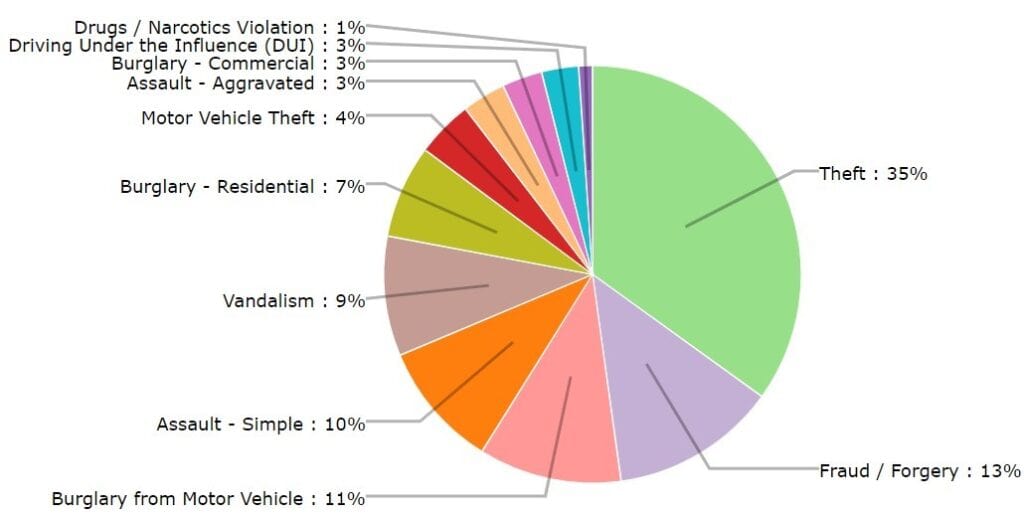
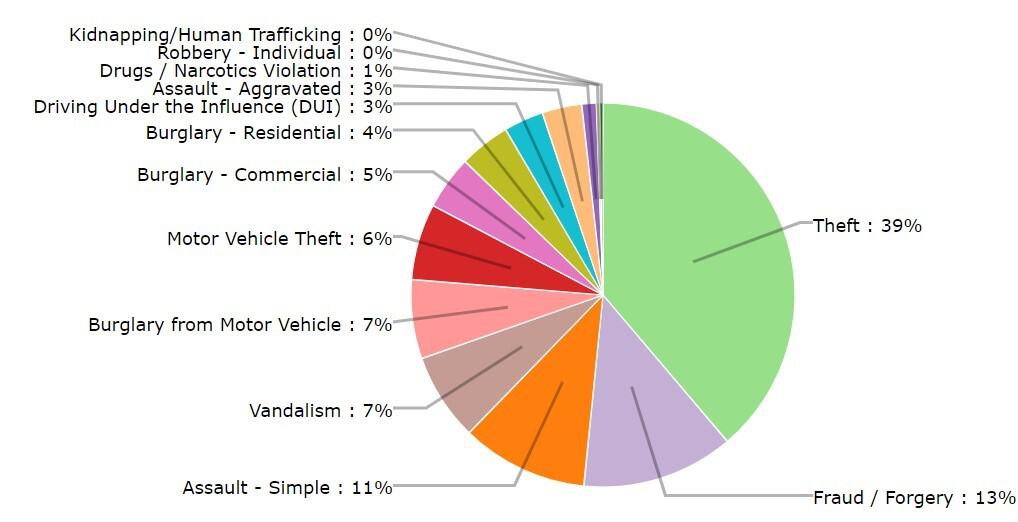
In 2023-2024, the top three crime sources in Black Forest were theft, simple assault, and motor vehicle theft, which made up over 50% of all crimes. Burglary from motor vehicle, commercial burglary and fraud/forgery were the next most prevalent, combining for an additional 31% of all crimes. In Falcon, the top three categories were theft, simple assault and vandalism with over 50% of all crimes related to theft and simple assault. Vandalism, residential burglary and fraud/forgery were the next three most prevalent, combining for an additional 21% of crimes.
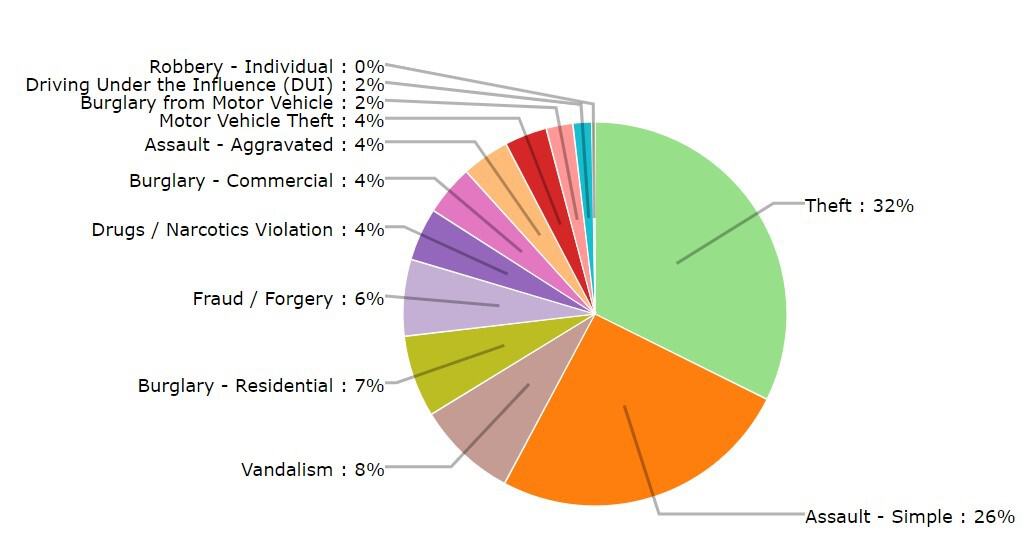
In comparison, 2019-2020, which was during the COVID-19 pandemic, theft made up around one-third of total crimes in both Black Forest and Falcon. In Black Forest, this was followed by fraud/forgery (13%), burglary from motor vehicle (11%), simple assault (10%), and vandalism (9%). In Falcon, it was simple assault (15%), fraud/forgery (10%), and burglary from motor vehicle (7%). Of note, burglary from all sources, which included commercial, residential and motor vehicle totaled 17% in Falcon and 21% in Black Forest.
Data limitation considerations
The Community Crime Map website allows a search radius buffer as little as 500 feet and as broad as 5 miles. However, the website limits each search to the first 500 reported cases and the pie charts reflect this. The 4-mile buffer was used as an estimate to cover a broad enough area to be representative of Black Forest and Falcon, while trying to minimize the number of crimes that would not be accounted for by the 500-case limit and minimizing skewed data from the increased activity in the Colorado Springs region. It is worth noting that significant crime activity in these bordering regions would be helpful as far as informing the likelihood of future spread into the Falcon and Colorado Springs areas. As a result, in years in which more than 500 crimes were reported, only the first 500 incidents sorted by date were included by each search query and so in the particular case of Falcon, there stands to be around 20% of additional data from 2019-2023 that was not reflected in the crime breakdown pie charts.
The Colorado Bureau of Investigation (https://coloradocrimestats.state.co.us/tops) also allows citizens to generate reports by jurisdiction, including the El Paso County Sheriff’s Office and local police departments like the Colorado Springs Police Department. While it allows the user to sort by a plethora of criteria, the site is much less user friendly, difficult to navigate and does not allow you to customize geographical areas to the extent that the Community Crime Map allows.
Breakdown By Crime Type (Black Forest Top, Falcon Bottom)
Sept 2023- Aug 2024
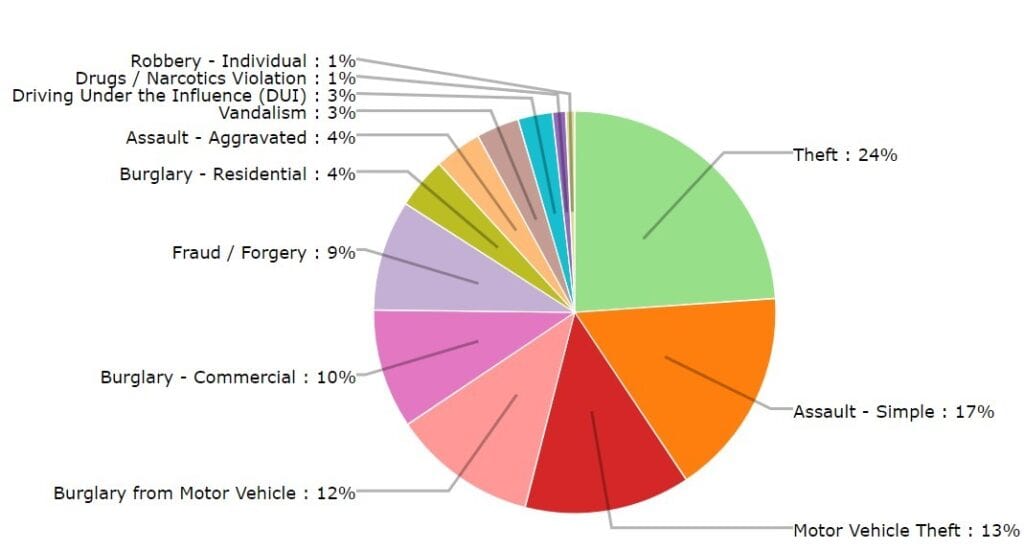
Sept 2021- Aug 2022
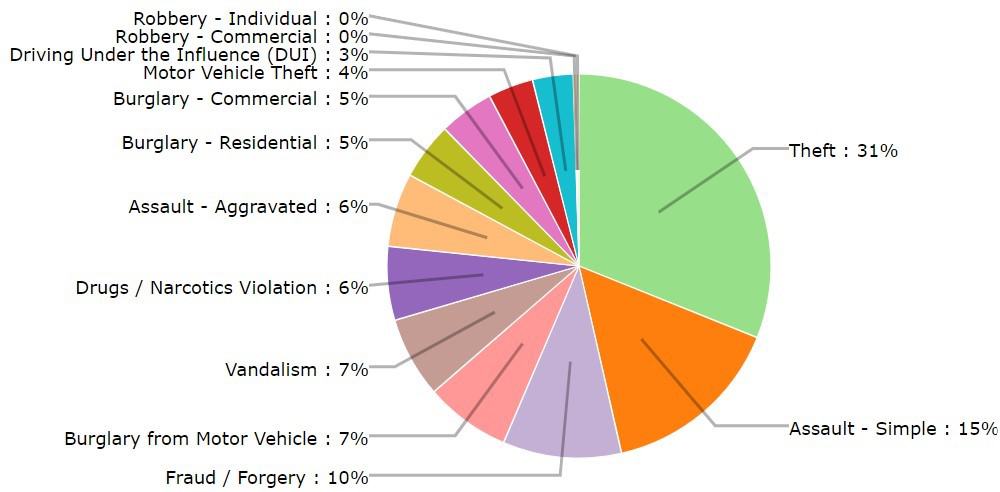
Sept 2019-Aug 2020